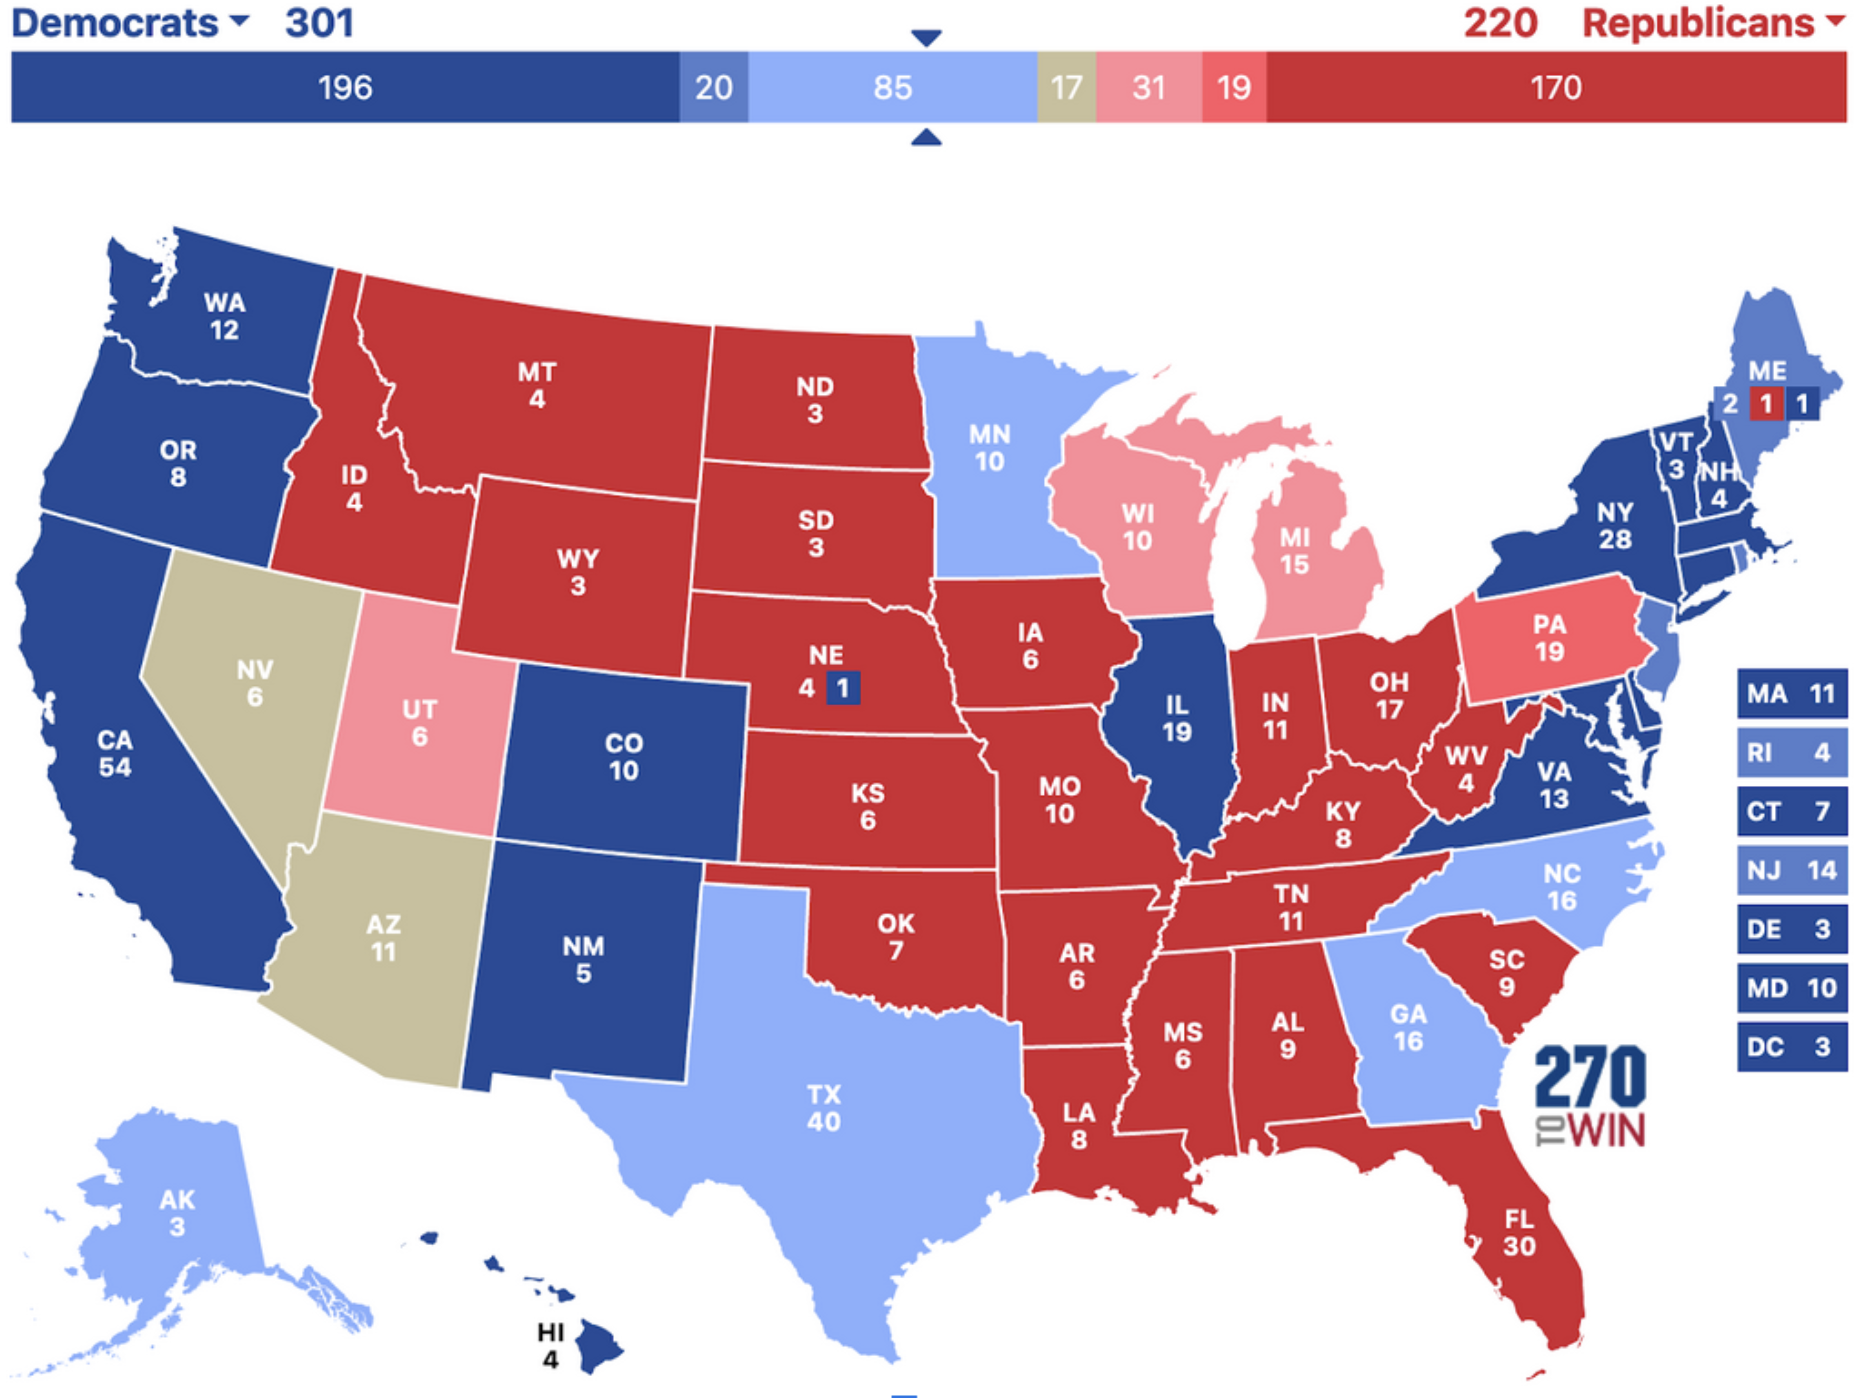
As you can see from the above map, Democrats would do quite well, but the Republicans can still win in a good year for them.
I live in the United States of America, which elects its President (who holds significant political power) using a fairly unusual method. I don't want to go into detail about this, but effectively, the President is elected based on the winners in each state. This leads to the classification of states as 'blue' or 'red', meaning that they reliably vote for the Democratic or Republican Party, respectively, in presidential elections. For example, Democratic candidates nearly always win the vote in California, so it is considered a blue state.
Of course, states don't just stay static — sometimes, states vote differently over time (whether because of changes in the views of the voters there or changes in the views of the candidates of each party). To measure these changes, I firstly need a way to objectively measure a state's partisan alignment. As the Cook PVI and FiveThirtyEight have shown, an easy way to do this is simply to compare a candidate's performance in a given state with their performance nationally.
For example, in 2020, the Republican presidential candidate got 56.9% of the vote in Montana, while the Democratic candidate got 40.5%. Since the Democratic candidate won the national popular vote by 4.5%, we can find that Montana voted 20.9 percentage points more Republican than the US overall; in other words, its lean is R+20.9.
By finding the lean of all states in two different election years and subtracting the old lean from the new lean,
we can determine how the partisan leanings of those states change over time.
If we add the change in lean over the past n years to the current lean, we can "predict"* how the state will vote n years from now.
I put a bunch of election data into a spreadsheet and crunched some numbers...
* this is a very crude prediction and will probably be wrong
Initially, I chose to compare the most recent Presidential election (2020) with the one in 2000, mostly because 20 years is a nice round number. As it turns out, most states shifted in the direction of the party they already aligned with (for example, Kentucky, which has been consistently Republican for many years, shifted 14.8 points towards Republicans). I suspect that this is a symptom of the overall polarisation that American politics has experienced recently. However, there are some more noteworthy changes:
Looking at the predicted 2040 alignments (following the process set out in the previous section), we see that:
As you can see from the above map, Democrats would do quite well, but the Republicans can still win in a good year for them.
This is an incredibly crude model for predictions and should be taken with a large grain of salt. The influence of third parties in the 2000 election, especially in states like Alaska and Rhode Island, probably distorted the projections. Also, this model doesn't account for shifts in political party positions, which don't necessarily regularly happen every 20 years. Donald Trump's influence on the Republican Party during and after 2016 was a major shift which may make this analysis faulty. Each party would also continue shifting its positions to appeal to as close to 50% of voters as possible; if Republicans consistently lose elections they will adjust their strategy.
That being said, I do think that there are some valuable insights here. Georgia is already becoming a swing state, and I think that this model's prediction that it will become a Democratic-leaning state is probably pretty accurate! The Rust Belt's rightward shift might just be an artifact of Trumpism that could be reversed if Democrats lean towards organized labor and left-wing populism, or it could be something that will continue. Texas, too, will probably be more and more of a swing state as its cities grow (Democrats tend to perform well in urban areas), though only time will tell to what extent.
If you have remarks, questions, or feedback about this analysis, feel free to email me at
anna@tilde.town if you are a tilde.town member or anna@mailmasker.com if you're not.
If you're interested in seeing the data I used to make these predictions, it's available in LibreOffice (.ods)
and Excel (.xlsx) formats.
This also includes some data and analyses for other elections that I haven't written about yet.
thanks for reading through this whole page; if you're American, please register and vote in the 2022 election.
~anna